The Netherlands comes second with €8.0 million, ahead of Ireland (€5.1 million), Portugal (€3.6 million), Belgium (€2.5 million) and Austria (€2.2 million).
For scale, France, Germany, Spain and Italy generated €499 million in the 90 days to 9 July 2026, roughly €166 million a month, as we showed in
our Q2 2026 analysis. The six markets covered here are worth about a fifth of that. They're growing fast, though: combined revenue rose 76% on the previous 30 days.
Five of the six are new. TikTok Shop opened in Austria, Belgium, the Netherlands and Poland on 15 June 2026, and Portuguese shoppers gained access the same month. Ireland launched in December 2024 alongside Spain, which makes it the closest thing to a mature market in this group. For the larger markets, see our ranking of
the top 10 brands on TikTok Shop in Europe, country by country.
*All figures are Kalodata estimates analysed by Lengow. Kalodata's exports stop at the first 100 rows, so for each country we worked with the 100 largest shops and the 100 largest categories. Shop rankings and shares therefore describe the top 100 sellers, not every shop on the platform. The last section explains how the numbers were built.
Poland sells the most, Ireland spends the most per head
Poland's lead comes from volume. Its top 100 shops sold 562,000 items in 30 days, 3.3 times as many as the Dutch top 100, at an average of €11.44 per item. In the other five markets the average item costs between €25 and €33.
The Polish market is also deeper. Seventeen shops passed €100,000 in the period. Leaving aside OQHAIR, whose figures repeat across markets (see below), the Netherlands had six, Ireland four and Portugal two, and no shop in Belgium or Austria got there.
Adjusted for population, the order changes. Ireland generated €0.94 per inhabitant, more than twice the Dutch level (€0.44) and four and a half times Belgium's (€0.21). Poland and Portugal sit at €0.33.
Growth was steepest in the two smallest markets. Portugal's revenue was 5.5 times its level of the previous 30 days and Austria's 3.5 times, both from a base of about €0.65 million. Poland, already the largest, grew 36%.
| Market |
TikTok Shop since |
Revenue, 30 days |
vs previous 30 days |
Revenue per inhabitant |
Largest shop (30-day revenue) |
| Poland |
15 June 2026 |
€11.9m |
+36% |
€0.33 |
Nutridome.pl (€230k) |
| Netherlands |
15 June 2026 |
€8.0m |
+89% |
€0.44 |
L'OYÉ Cosmetics (€490k) |
| Ireland |
December 2024 |
€5.1m |
+52% |
€0.94 |
BPerfect Ireland (€370k) |
| Portugal |
June 2026 |
€3.6m |
+448% |
€0.33 |
Utopya Shop_Portugal (€229k) |
| Belgium |
15 June 2026 |
€2.5m |
+92% |
€0.21 |
OQHAIR† (€146k) |
| Austria |
15 June 2026 |
€2.2m |
+249% |
€0.24 |
OQHAIR† (€147k) |
Source: Kalodata estimates, Lengow analysis. Revenue is the sum of top-level categories in each market's top 100 category export, 7 October to 5 November 2026 (6 October to 4 November for Poland and the Netherlands). Population: Eurostat, 1 January 2025. † This storefront's figures repeat almost identically across markets; see "One storefront, six markets" below.
Videos sell in Ireland and Poland, listings sell in Austria, Portugal and Belgium
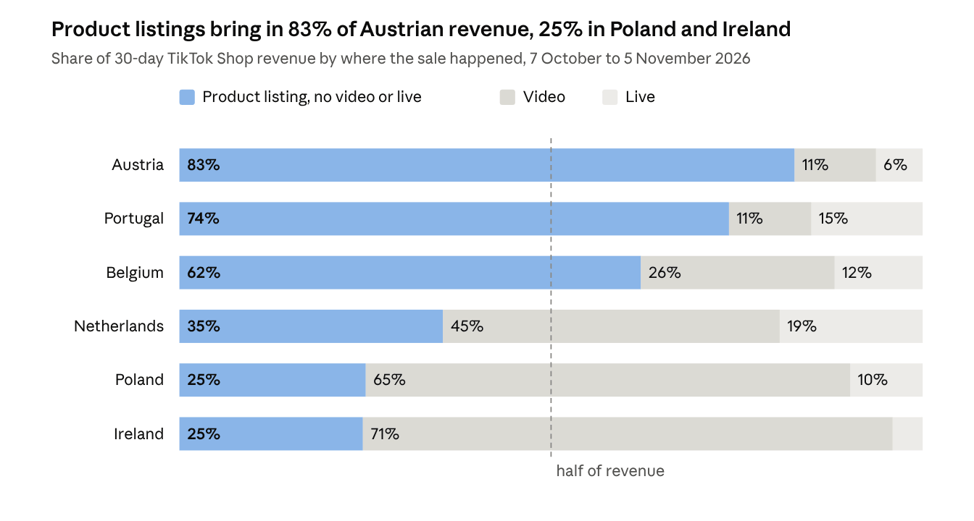
The six markets split in two once you look at where the sale happens. In Ireland and Poland, most revenue comes from content: videos alone bring in 71% of Irish sales and 65% of Polish ones. In Austria, Portugal and Belgium, the product listing does most of the work.
Kalodata estimates, Lengow analysis · sum of top-level categories per market, 7 Oct to 5 Nov 2026 (PL and NL: 6 Oct to 4 Nov) Kalodata records a product card sale when the buyer orders straight from a product page, reached through search, the Shop tab or a storefront, with no video or live attached.
The account data tells the same story. Affiliate creators generate 70% of Irish revenue and 58% of Polish revenue. In Austria they bring in 28%, while 68% goes through TikTok's Shopping Mall with neither a creator nor the seller's own account involved. Portugal follows the same pattern, with 63% through the Mall. Belgium is split: 47% through the Mall, 49% through affiliates.
The Netherlands sits between the two groups, with one quirk: 19% of Dutch sales happen on live streams, the highest share of the six, and almost half of that comes from a single category, trading cards.
Why the gap? Part of the answer is who sells: as the next section shows, many sellers in these markets come from other markets and arrive with listings rather than local creators. Local supply also had a slower start. According to
Synlighetsverket, Austrian businesses had to apply by email instead of registering themselves, and in Portugal the products on offer come from sellers based in other countries. The Shop tab, which TikTok began rolling out in the new markets in July, gives those listings a place to be found.
A shared European shelf
In Belgium, all ten of the largest shops also rank, under the same name, in the top 100 of at least one other market in this analysis. Sellers of that kind take 80% of the Belgian top 100's revenue. The share is about 70% in Austria and 58% in Portugal. In Poland it's 19%, and only one of the ten largest shops, Ninja Kitchen, also sells under its name elsewhere in the group.
TikTok built the platform for this. Its Sell Across Europe feature lets sellers already on TikTok Shop in one EU market localise their listings and ship to the others,
according to TikTok. Since 19 October, eligible UK sellers can also reach 12 EU countries, five of the six covered here among them,
ChannelX reported.
Portugal shows the result. Its top ten reads like a Spanish ranking. The four largest brands in Spain in
our previous analysis, MIKOMIKA, Aldous, Utopya and Armonias, all rank in it. Utopya now leads Portugal with €229,000, 69% of it sold on live streams.
Sharing a language or a border doesn't guarantee a transfer, though. The two largest Dutch shops, L'OYÉ Cosmetics and TCG OOST, made €490,000 and €247,000 at home, and about €5,000 and €6,000 in Belgium. In Austria, Halara, MORE Nutrition, Ninja and Pammys, all in Germany's top 10 in our earlier ranking, sold €42,000, €13,000, €10,000 and €5,000 respectively.
One storefront, six markets
One seller exposes a limit of the data. The wig seller OQHAIR ranks first in Austria and Belgium, second in Portugal, third in Ireland and fourth in the Netherlands, each time with €143,000 to €151,000 and around 2,000 units sold. In Poland, the same storefront shows exactly the Dutch unit count, 2,064, with 4.4 times less revenue. Eleven other storefronts repeat across markets in the same way: the microphone brand fifine reports exactly €22,107 and 441 units in both Austria and Belgium.
These look like the same cross-border sales counted in every market where the listing appears. We left them in the shop rankings, marked †, because that's how Kalodata reports them, but they shouldn't be read as national sales. The market totals, built from Kalodata's category data, look less exposed: in Ireland, OQHAIR's €148,000 is more than the entire wig category (€101,000), so the category data can't contain its repeated figure in full. Even if every repeated figure were taken out of the totals, the ranking of the six markets wouldn't change.
What sells: beauty and fashion first, then a local speciality
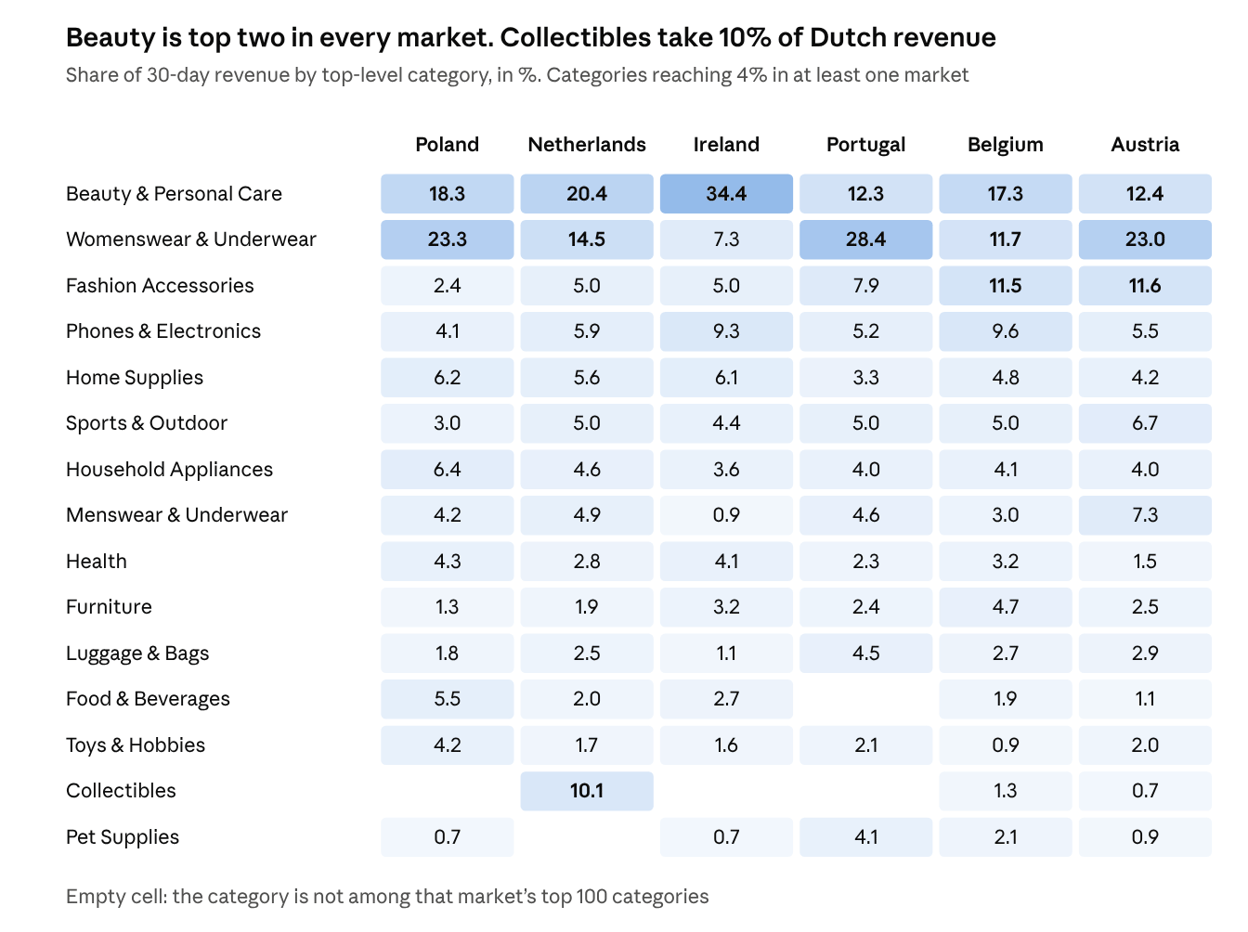
Beauty ranks first or second in every market, and together with womenswear it brings in 29% to 42% of revenue. Ireland is the only market where those two aren't the top pair: phones and electronics come second there, ahead of womenswear. Below them, each market has its own speciality.
Kalodata estimates, Lengow analysis · top-level categories in each market's top 100 category export, 7 Oct to 5 Nov 2026 (PL and NL: 6 Oct to 4 Nov)
In the Netherlands, it's trading cards. Collectibles brought in €808,000, a tenth of the Dutch market, and 88% of it was sold on live streams run by the sellers themselves. Non-sports trading cards, the Pokémon-style packs collectors open on camera, account for €626,000 on their own. TCG OOST, Card-Binder and TCG's rank second, third and fifth in the Dutch top 100.
Ireland is the beauty market. The category takes 34% of Irish revenue, almost three times its share in Austria or Portugal. Make-up sets alone weigh €410,000, and three shops take 80% of that. Haircare and styling adds another €317,000.
Poland eats and trains. Food and drink reaches 5.5% of revenue, more than in any other market here, and fitness supplements are tightly held: ten shops take 99% of the category.
Portugal has pets and suitcases. Pet supplies reach 4.1% of revenue, the highest share of the six, in a category dominated by Yommymascota, third in the Portuguese ranking with €125,000. Luggage is even more concentrated: three shops account for 96% of its €103,000.
Belgium and Austria lean on fashion accessories, at 11.5% and 11.6% of revenue against 2.4% in Poland. Most of it is wigs and hair extensions, €184,000 in Belgium and €156,000 in Austria, about 7% of each market and the highest shares of the six. Almost all of it sells from listings.
Country by country
Each table lists the five largest shops by 30-day revenue. Type is Kalodata's classification of the seller as a brand or a retailer. † Figures repeat almost identically across markets (see "One storefront, six markets").
Poland: big, cheap and local
Poland has the flattest ranking of the six. The leader, Nutridome.pl, takes just 3.6% of the top 100's revenue, and the ten largest shops 30% between them. Polish brands hold the top: Nutridome, the sports nutrition makers SFD and OstroVit, and the cosmetics brands Eveline and PAESE all rank in the top 25.
Prices are low and volumes high. SFD sold 52,016 items at an average of €4.38. Video drives 65% of revenue, but sellers' own accounts also carry more weight than anywhere else, with 23% of sales. Seventeen of the top 100 shops make at least 80% of their revenue through their own accounts, most of them fashion boutiques such as EmilyStyle, PromkaButik and Lalineabutik.
| Poland · TikTok Shop since 15 June 2026 · €11.9m in 30 days |
| # |
Shop |
Type |
Revenue |
Units |
Avg. price |
Main sales channel |
| 1 |
Nutridome.pl |
Brand |
€230k |
22,718 |
€10.14 |
Video (69%) |
| 2 |
SFD |
Brand |
€228k |
52,016 |
€4.38 |
Video (90%) |
| 3 |
ModoMania |
Brand |
€216k |
19,784 |
€10.91 |
Video (93%) |
| 4 |
Taniej Nie Kupisz |
Retailer |
€207k |
28,872 |
€7.17 |
Video (94%) |
| 5 |
Jiaxiya Store |
Retailer |
€190k |
13,126 |
€14.49 |
Video (90%) |
Netherlands: eyeshadow and card packs
L'OYÉ Cosmetics, a Dutch eyeshadow and mineral make-up brand, is the largest shop in any of the six markets: €490,000 in 30 days, or 11.5% of the Dutch top 100's revenue. It sells in every format at once, with 38% of revenue from videos, 33% from lives and 29% from listings, and almost a third goes through its own accounts.
Nimya, the beauty brand of Dutch creator NikkieTutorials, ranks eighth with €98,000, more than half of it sold through its own account. Around the beauty brands, trading-card sellers hold four of the top ten places, which makes the Netherlands the most live-driven market of the six. Revenue grew 89% on the previous 30 days.
| Netherlands · TikTok Shop since 15 June 2026 · €8.0m in 30 days |
| # |
Shop |
Type |
Revenue |
Units |
Avg. price |
Main sales channel |
| 1 |
L'OYÉ Cosmetics |
Brand |
€490k |
17,826 |
€27.48 |
Video (38%), live (33%) |
| 2 |
TCG OOST |
Brand |
€247k |
7,175 |
€34.40 |
Live (97%) |
| 3 |
Card-Binder |
Brand |
€152k |
3,575 |
€42.54 |
Live (83%) |
| 4 |
OQHAIR† |
Retailer |
€151k |
2,064 |
€73.23 |
Product listing (100%) |
| 5 |
TCG's |
Brand |
€147k |
3,681 |
€39.87 |
Live (90%) |
Ireland: local beauty brands, sold by creators
Ireland, live since December 2024, is the market where the top 100 shops weigh most: they take about two thirds of all revenue, more than anywhere else in the group. The leaders are local beauty names. BPerfect, the Belfast-based tanning and cosmetics brand, leads with €370,000, ahead of the Irish hair-tool brand Voduz (€210,000). Betty and Biddy, Millies.ie and the make-up brand KASH Beauty, all Irish, also make the top seven.
Creators do the selling. Affiliates generate 70% of Irish revenue, the highest share of the six, and live streams just 4%, the lowest. If the newer markets are heading somewhere, it may look like this: established local brands pushed by a broad base of creators. The caveat is that an English-speaking market next door to the UK, Europe's most developed TikTok Shop market, may simply be a special case.
| Ireland · TikTok Shop since December 2024 · €5.1m in 30 days |
| # |
Shop |
Type |
Revenue |
Units |
Avg. price |
Main sales channel |
| 1 |
BPerfect Ireland |
Brand |
€370k |
8,749 |
€42.25 |
Video (87%) |
| 2 |
Voduz Ireland |
Brand |
€210k |
4,652 |
€45.23 |
Video (92%) |
| 3 |
OQHAIR† |
Retailer |
€148k |
1,989 |
€74.25 |
Product listing (100%) |
| 4 |
BettyandBiddy |
Retailer |
€144k |
4,761 |
€30.29 |
Video (87%) |
| 5 |
Millies.ie |
Brand |
€123k |
4,471 |
€27.41 |
Video (92%) |
Portugal: Spanish sellers, live fashion
Portugal grew fastest of the six, reaching €3.6 million, 5.5 times its level of the previous 30 days. Womenswear takes 28% of revenue, a larger share than in any other market here. Sellers' own accounts bring in just 1.3% of sales, the lowest of the six, consistent with a market served largely from abroad.
Spanish sellers set the pace. Utopya leads with €229,000, most of it through affiliates' live streams, and Armonias, MIKOMIKA and Aldous also make the top ten. Lives account for 15% of Portuguese revenue, the second-highest share after the Netherlands. Most of the rest runs on listings: 54 of the top 100 shops make at least 90% of their sales without a video or a live.
| Portugal · TikTok Shop since June 2026 · €3.6m in 30 days |
| # |
Shop |
Type |
Revenue |
Units |
Avg. price |
Main sales channel |
| 1 |
Utopya Shop_Portugal |
Retailer |
€229k |
6,968 |
€32.92 |
Live (69%) |
| 2 |
OQHAIR† |
Retailer |
€143k |
1,900 |
€75.13 |
Product listing (100%) |
| 3 |
Yommymascota_Portugal |
Brand |
€125k |
8,039 |
€15.52 |
Product listing (65%) |
| 4 |
1990s Maletas y Bolsos_Portugal |
Retailer |
€96k |
1,349 |
€71.40 |
Product listing (71%) |
| 5 |
ARMONIAS PORTUGAL |
Brand |
€92k |
1,762 |
€52.48 |
Product listing (95%) |
Belgium: a European selection, little local depth
Belgium has the lowest revenue per inhabitant of the six, €0.21, less than half the Dutch level, even though Flemish shoppers share a language with the Netherlands. Only one shop passed €100,000, and it's OQHAIR, whose figures repeat across markets. The largest shop with Belgium-specific figures is Landot-BE, at €87,000, mostly from videos pushed by affiliates.
The Belgian top 100 is essentially a European selection: every one of the top ten also sells in at least one other market in this analysis. Phones and electronics (9.6% of revenue) and furniture (4.7%) take larger shares here than anywhere else in the group, and revenue grew 92% on the previous 30 days.
| Belgium · TikTok Shop since 15 June 2026 · €2.5m in 30 days |
| # |
Shop |
Type |
Revenue |
Units |
Avg. price |
Main sales channel |
| 1 |
OQHAIR† |
Retailer |
€146k |
1,963 |
€74.37 |
Product listing (100%) |
| 2 |
Landot-BE |
Brand |
€87k |
2,030 |
€42.71 |
Video (69%) |
| 3 |
SoundVibe BE |
Retailer |
€39k |
1,581 |
€24.89 |
Video (71%) |
| 4 |
DWY WIGS BELGIUM |
Brand |
€37k |
475 |
€78.33 |
Product listing (97%) |
| 5 |
CharmBag |
Retailer |
€30k |
1,244 |
€24.05 |
Product listing (100%) |
Austria: the catalogue market
Austria shares a language with Germany, the largest TikTok Shop market on the continent with €175 million in the 90 days to 9 July, yet it's the smallest of the six at €2.2 million. It's also where TikTok Shop behaves most like a classic marketplace. Product listings bring in 83% of revenue, and 66 of the top 100 shops make at least 90% of their sales from them. Videos account for 11%, lives for 6%.
Set OQHAIR aside and the largest shop is cfab_Austria, with €58,000, mostly from its own live streams. Halara, fifth with €42,000, is one of the few top-ten sellers driven by video. Revenue was still 3.5 times its level of the previous 30 days. Womenswear, the largest category, rose 618%, and sports and outdoor 653%.
| Austria · TikTok Shop since 15 June 2026 · €2.2m in 30 days |
| # |
Shop |
Type |
Revenue |
Units |
Avg. price |
Main sales channel |
| 1 |
OQHAIR† |
Retailer |
€147k |
1,972 |
€74.76 |
Product listing (100%) |
| 2 |
cfab_Austria |
Brand |
€58k |
2,869 |
€20.34 |
Live (62%) |
| 3 |
Hugcitar |
Retailer |
€52k |
2,008 |
€25.65 |
Product listing (100%) |
| 4 |
OYEIE |
Retailer |
€48k |
1,643 |
€29.50 |
Product listing (100%) |
| 5 |
Halara Austria |
Brand |
€42k |
1,358 |
€31.07 |
Video (74%) |
What it means for brands and retailers
Pick the playbook market by market. In Poland and Ireland, sales follow content, so the budget goes to creators, samples and affiliate commissions, and a listing with no videos behind it will struggle. In Austria, Portugal and Belgium, the listing sells. Titles, images, prices, attributes and stock, localised for each storefront, do most of the work, at least until local creator networks grow.
Expect European competition in the smaller markets. In Belgium and Austria, most of the top 100's revenue already goes to sellers active in several markets. For brands already selling on TikTok Shop elsewhere in the EU, that's also an opening. Sell Across Europe turns a new country into an extension of an existing storefront, which appears to be how Spain's leading brands reached Portugal's top ten.
Don't assume a neighbour will follow. Dutch leaders barely register in Belgium, and Ninja, Germany's largest TikTok Shop brand in our earlier ranking, sold just €10,000 in Austria. Each storefront needs its own push, and its own price points: Poland's average item costs €11.44, about a third of the Belgian average (€32.75).
Running one catalogue across several TikTok Shop storefronts, each with its own language, prices and stock, is largely an operations problem. It's the kind of work a feed management platform such as Lengow is built for.
How to read these numbers
All figures are Kalodata estimates, modelled from public TikTok Shop data. They are not revenue reported by TikTok or by the sellers, and they cover TikTok Shop sales only, in euros. Kalodata converts Polish złoty itself.
Kalodata exports stop at the first 100 rows. For each market we used two exports: the 100 largest shops and the 100 largest categories by revenue. Rankings, shares and shop counts therefore refer to the top 100, not to every seller on the platform. Those 100 shops account for roughly 40% to 70% of each market's revenue, depending on how the † storefronts are counted.
The period runs from 7 October to 5 November 2026. The Polish and Dutch exports cover 6 October to 4 November, one day earlier.
Market revenue is the sum of the top-level categories in the category export, which mixes three levels of the category tree. Top-level categories below the 100th row are missing, so totals are slightly understated, by up to about 4%. Growth compares each top-level category with the previous 30 days, using Kalodata's growth rates.
Kalodata splits revenue two ways. By format: live, video, or product card, meaning a purchase made straight from a product page with no video or live attached. By account: the seller's own accounts, affiliate creators, or the Shopping Mall. Both splits are summed from the top-level categories; shop-level splits come from the shop export.
Twelve storefronts share the same shop ID across markets, with near-identical figures everywhere except OQHAIR's Polish entry. We read them as the same cross-border sales counted more than once and mark them †. In the shop exports they add up to €1.36 million across the six markets, of which about €1.06 million would be duplication if each storefront were counted once. Market totals come from the category exports, which don't appear to include these figures in full; removing them entirely wouldn't change the market ranking.
Sellers "active in several markets" are shops that appear under the same name, with or without a country suffix, in the top 100 of at least one other market in this analysis. Population figures come from Eurostat (1 January 2025).