.png?width=48&height=48&name=Adrian%20(1).png)
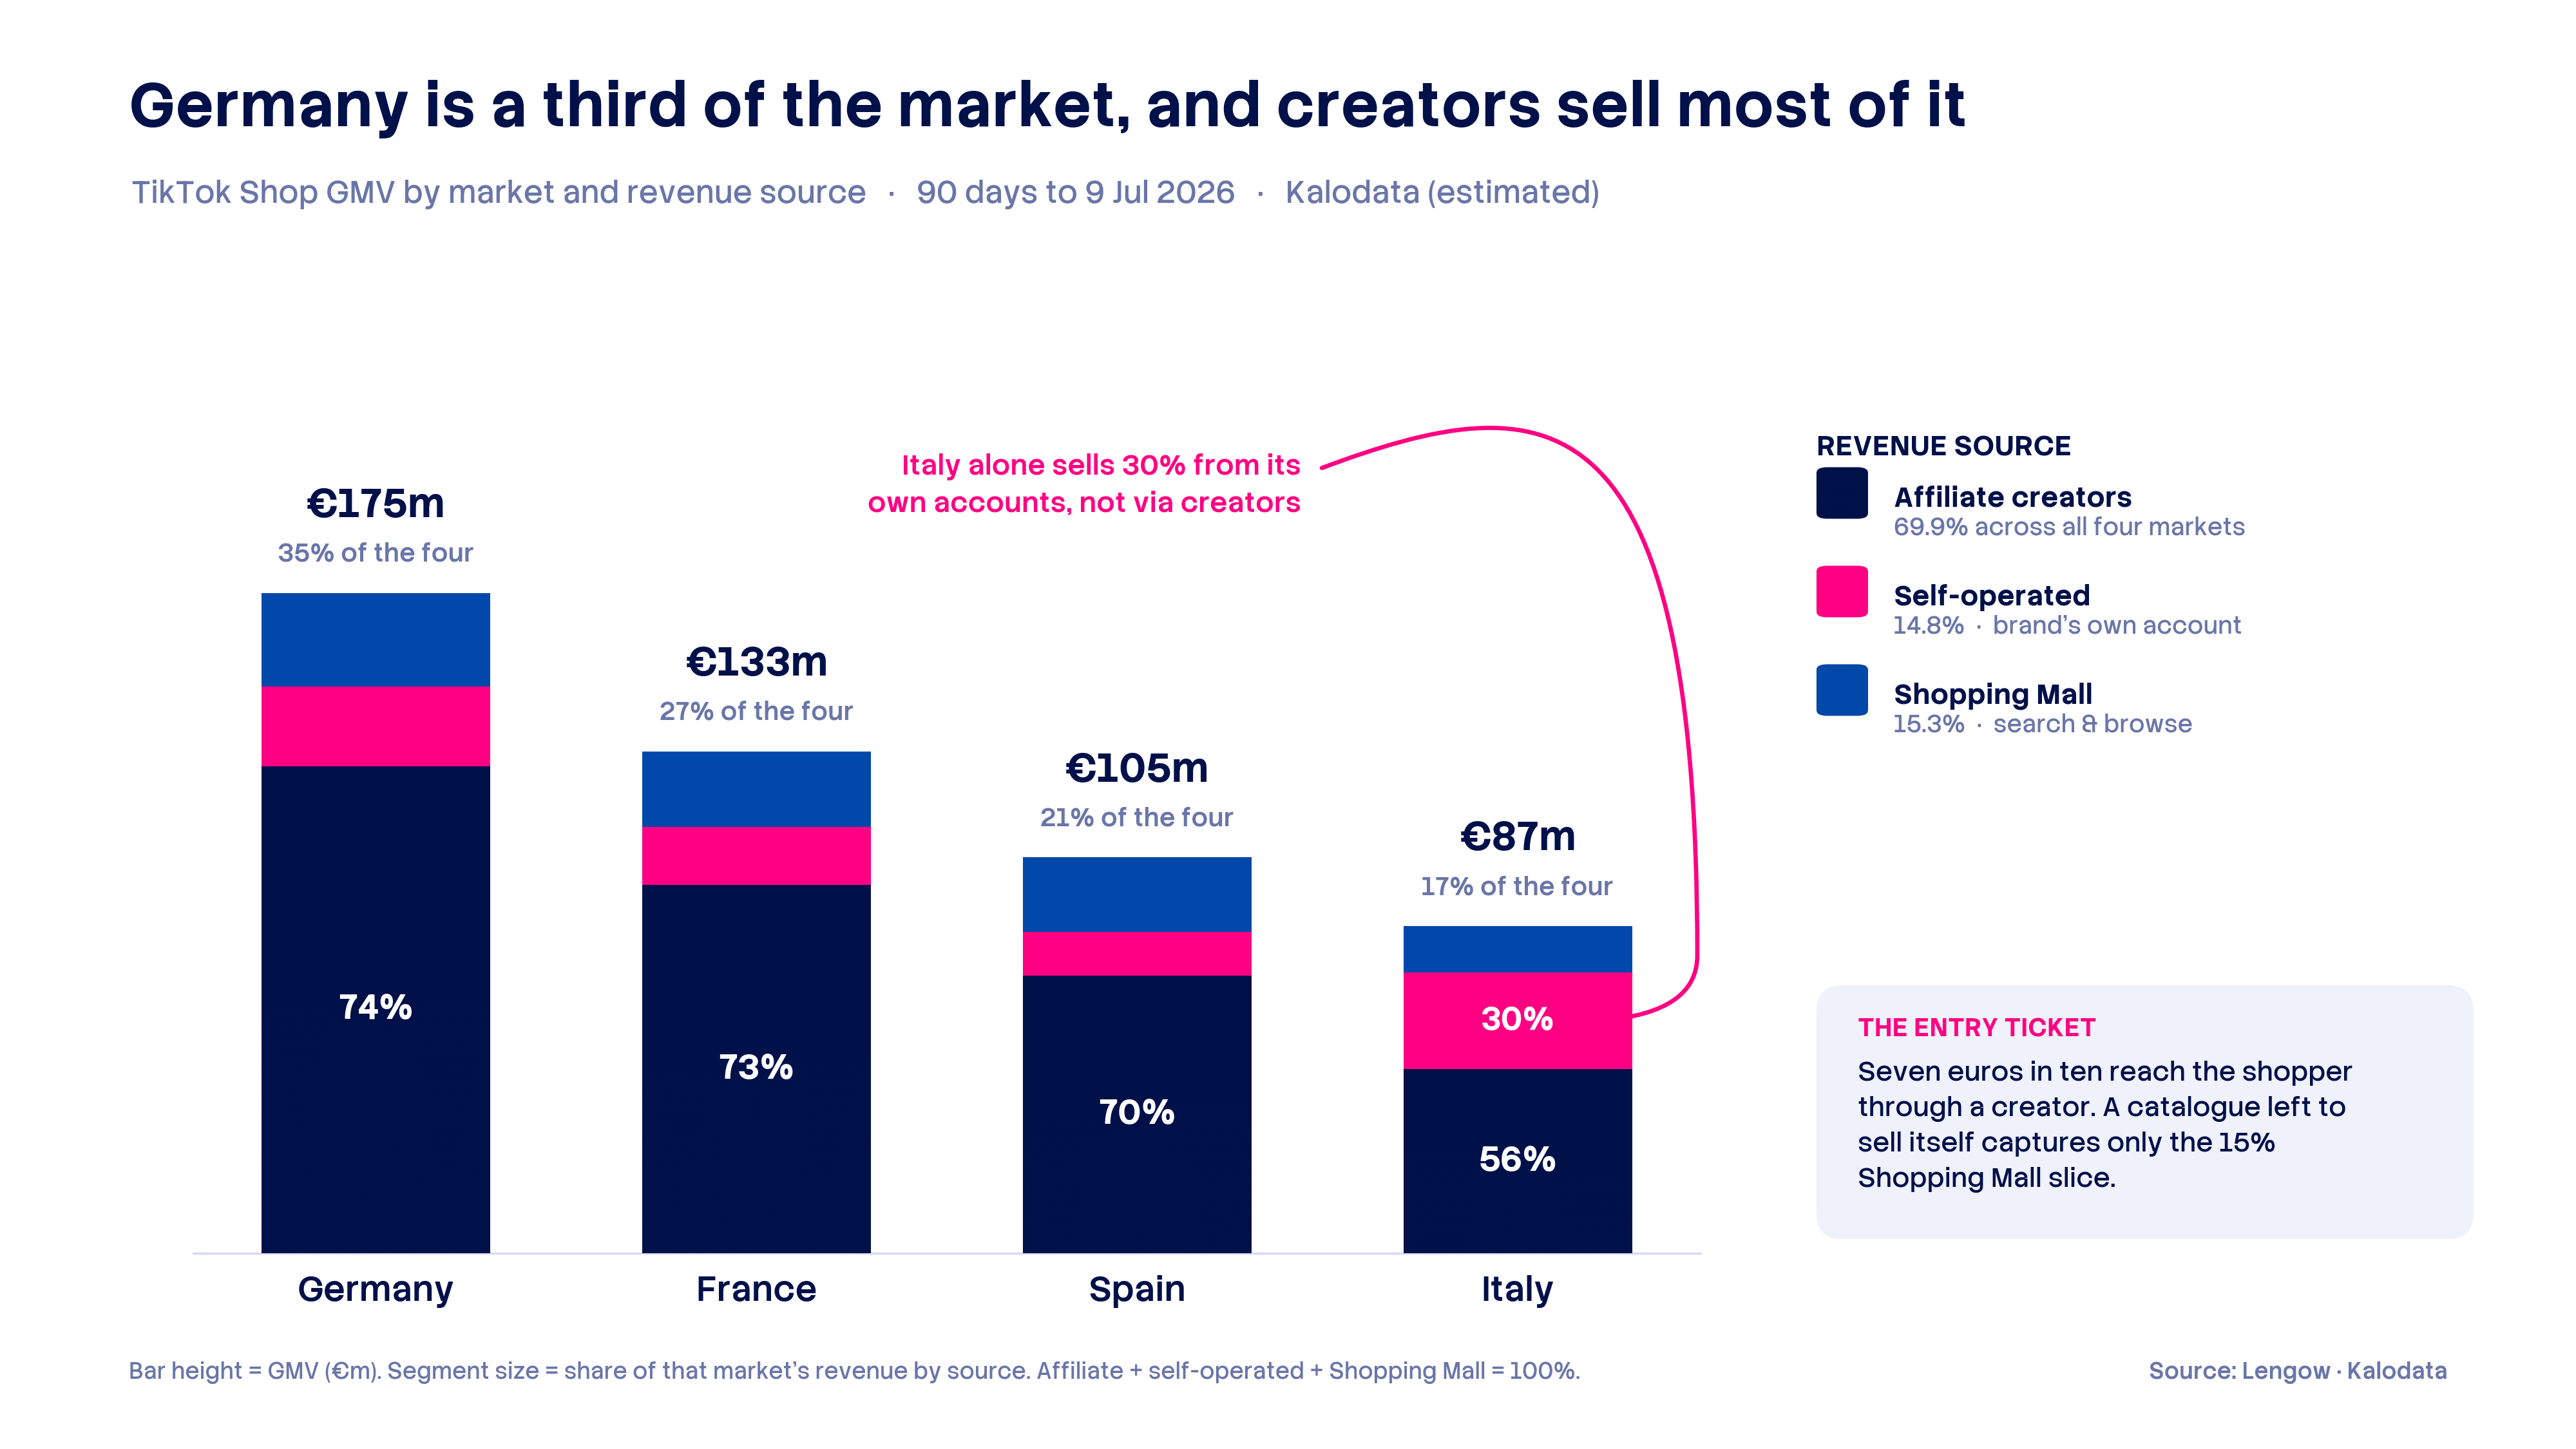
Germany is a third of the market
TikTok Shop GMV by market, 90 days to 9 July 2026
| Market | GMV (€) | Share of the four |
|---|---|---|
| Germany | 174 682 677 | 35.0 % |
| France | 132 786 016 | 26.6 % |
| Spain | 104 745 541 | 21.0 % |
| Italy | 86 565 685 | 17.4 % |
| Total | 498 779 919 | 100 % |
Level-1 categories, 29 per market. Source: Lengow · Kalodata (estimated).
Germany, France and Italy all opened on 31 March 2025. Spain and Ireland went first, in December 2024. Six months of head start have not made Spain the largest market, and eighteen months in, the German lead is wide enough that it looks structural rather than temporary.
Germany's advantage is one category: Household Appliances turned over €29.8m, 17.1% of German GMV and the largest single category in any of the four markets. Beauty & Personal Care follows at €27.6m. Everywhere else, that order is reversed: Beauty leads France (18.3% of national GMV), Italy (17.7%) and Spain (15.9%), while appliances fall to 12.5% in France, 10.7% in Spain and 7.4% in Italy.
In a nutshell: An air fryer sells in Germany the way a serum sells in Milan.
The affiliate engine
Revenue source mix by market
| Market | Affiliate | Self-operated | Shopping Mall |
|---|---|---|---|
| Germany | 73.8 % | 12.1 % | 14.1 % |
| France | 73.4 % | 11.6 % | 15.0 % |
| Spain | 70.2 % | 11.0 % | 18.8 % |
| Italy | 56.3 % | 29.6 % | 14.2 % |
| Four markets | 69.9 % | 14.8 % | 15.3 % |
Share of revenue by source. Affiliate + self-operated + Shopping Mall = 100 %. Source: Lengow · Kalodata (estimated).
Zoom into a category and the dependency sharpens. German Household Appliances runs at 90.7% affiliate. Spanish Household Appliances at 88.9%. French at 83.2%. These are considered purchases, several hundred euros, and they are being sold almost entirely by third parties talking to a camera.
This reorders the cost of entry. Getting the feed right, mapping attributes to TikTok's fields, holding price and stock in sync, meeting delivery windows measured in hours rather than days: all of that is the ticket, and it's a solved problem when someone competent handles it. The recurring expense is creator commission and the operational work of running an affiliate programme. Budget for TikTok Shop as a media line, not a distribution line.
Live shopping is smaller than everyone assumes
GMV by sales channel
| Market | Live | Video | Product card |
|---|---|---|---|
| Germany | 12.6 % | 69.8 % | 17.7 % |
| France | 20.2 % | 61.6 % | 18.2 % |
| Spain | 19.2 % | 58.7 % | 22.0 % |
| Italy | 19.7 % | 61.4 % | 18.9 % |
| Four markets | 17.2 % | 63.8 % | 18.9 % |
Live + Video + Product card = GMV. Source: Lengow · Kalodata (estimated).
Shoppable video does two thirds of the work. Live does one euro in six across the four markets, and in Germany one in eight. TikTok's own communication leans hard on live shopping, and there are good reasons for that beyond revenue: a live session is a product demo, a research panel and a customer service desk at once. But on GMV alone, a brand entering Germany that builds its programme around livestreams is optimising for the smallest of the three surfaces.
France runs live at 20.2%, sixty percent hotter than Germany. Same platform, same year, but different selling culture.
Spain browses
Spain posts the highest Shopping Mall share of the four, 18.8%, three to five points above its neighbours. Inside Spanish categories the effect is stronger still: Phones & Electronics take 26.2% of revenue through the Mall tab, Womenswear 24.7%, Sports & Outdoor 20.7%, Beauty 20.5%.
Spain is also the market that has had TikTok Shop the longest. The tempting reading is that maturity produces search behaviour, that after eighteen months a share of the audience stops waiting to be shown things and starts going to look for them. The data here can't prove that. It's one country, one quarter, and Ireland isn't in the sample to corroborate it. But if it holds, it's the single most important structural question for anyone modelling this channel three years out, because a Shopping Mall euro costs nothing in creator commission.
Italy sells differently
Italy's self-operated share is 29.6%, roughly two and a half times its neighbours. The obvious explanation is that Italian brands run their own accounts. The obvious explanation is wrong.
Across Italy's ten largest shops, self-operated revenue falls to 18.1%. The 29.6% comes from further down, and from specific categories. Italian Collectibles run at 75.9% self-operated, Fashion Accessories 49.7%, Shoes 48.3%, Womenswear 40.3%, Home Supplies 39.8%. Trading cards sold live by the seller who owns them. Clothing sold from the merchant's own account to the merchant's own audience.
An Italian seller with a following behaves like a shopkeeper. A German appliance brand behaves more like an advertiser.
Home Improvement, in four countries at once
Filter Kalodata's category growth to anything above €2m and rank by growth rate, and the same name comes out first in all four markets. Home Improvement: +228% in Germany, +298% in Spain, +207% in Italy, +202% in France. Nothing else is simultaneously that large and that fast.
Four countries, four consumer cultures, two different launch dates, one category accelerating in lockstep. That isn't a national trend. It's either the recommendation engine finding a category, or a cohort of creators finding a format that converts, or both feeding each other. For a category manager it is the clearest opening in the dataset: demand is real, supply is thin enough that a triple-digit swing is possible, and nobody has locked it down.
Thirty days of shop data
Kalodata's top-ten shop pull covers a different window, 10 June to 9 July 2026. Forty shops, €37,895,846 in combined revenue.
SharkNinja takes 28.5% of it.
The company runs five storefronts across the four markets. Ninja Kitchen is number one in Germany, Spain and Italy, and number three in France, for €8,262,768 in thirty days. Shark Clean DE adds €2,543,843 and is Germany's second-largest shop in its own right. Combined: €10,806,610.
Largest shop per market, 30 days to 9 July 2026
| Market | Largest shop | 30-day revenue (€) |
|---|---|---|
| Germany | Ninja Kitchen DE | 3 888 378 |
| France | SPZTJK-EU | 1 773 989 |
| Spain | Ninja Kitchen ES | 1 464 995 |
| Italy | Ninja Kitchen IT | 1 304 806 |
Ninja Kitchen (SharkNinja) is the #1 shop in Germany, Spain and Italy. Source: Lengow · Kalodata (estimated).
There's an independent check available. Announcing its European expansion on 28 May 2026, TikTok named twelve household-name brands it says are thriving on TikTok Shop across Europe, and six local fast-growing businesses. Four of the household names appear unprompted in these revenue leaderboards: SharkNinja, Carrefour, Philips and NABLA. One of the local names, Pammys, does too, in tenth place in Germany. TikTok's marketing list and Kalodata's revenue ranking agree, which is rarer than it should be.
Brands take 80.0% of top-ten revenue across the four markets, resellers 20.0%. Italy is the most brand-heavy at 86.4%.
Two findings survive the period mismatch. First, the ten largest shops in each country are consistently more affiliate-dependent than their national average: 93.5% against 73.8% in Germany, 85.0% against 70.2% in Spain, 83.9% against 73.4% in France, 76.3% against 56.3% in Italy. The affiliate network is what makes a shop large. It isn't something shops adopt once they get there.
Second, concentration. The top ten capture at most 23.5% of the German market, 23.7% of the French, 24.1% of the Spanish and 18.4% of the Italian. Those are ceilings rather than measurements, for reasons set out in the method note below, so the real shares sit lower. What survives is the ordering. Italy's leaders hold five to six points less of their market than the other three. Italian TikTok Shop is flatter, and that is consistent with everything else Italy does in this dataset.
The retailer exception
Across forty of Europe's largest TikTok Shop storefronts, two belong to incumbent bricks-and-mortar chains. Both are French.
Carrefour France ranks seventh nationally with €774,637 and an average unit price of €211.30. Darty ranks ninth with €639,122 across 4,488 items, at €142.41 a unit, more than three times the €46.26 blended average of the French top ten. Between them the two chains hold 13.5% of that leaderboard. No German, Spanish or Italian incumbent appears anywhere in its national top ten.
Darty's storefront went live on 10 June 2025, built in forty days as a pilot with Lengow, which already handled its marketplace feeds and TikTok Ads. It opened with about twenty references chosen for season and price: fans, granita machines, ice cream makers, an air fryer, an LED mask. Darty kept fulfilment and after-sales; TikTok keeps the customer data.
A year later the storefront runs at 92.9% affiliate and 54.9% live, the highest live share in the French top ten, ahead of Ninja Kitchen at 48.6% and Carrefour at 40.8%.
That 92.9% is also the check promised at the top of this piece. Ecommerce Nation, covering the launch, reported that roughly 90% of orders were coming through affiliated creators, a figure from Darty rather than from a scraper. Kalodata's independent estimate lands within three points of it. One storefront doesn't validate a model, but it's the only external reading available, and it points the same way.
That is the whole channel in a single shop. High-consideration goods, high basket, sold live by other people.
What Q2 was the last of
On 15 June 2026, in the middle of the shop window above, TikTok Shop opened in Austria, Belgium, the Netherlands and Poland, taking Europe to ten markets. Shortly afterwards it began rolling out Sell Across Europe, letting a seller localise product descriptions, ship into other markets through partnered logistics providers, and open its products to approved creators across the EU affiliate network.
Until now, a serious European presence meant a separate registration, a separate feed and a separate creator programme per country. That's why SharkNinja runs four Ninja Kitchen storefronts instead of one. It's why a retailer could pilot in a single market and stop.
TikTok says over 100,000 European businesses have joined across France, Germany, Italy, Spain and Ireland since launch, and that daily GMV across those markets grew in triple digits between August 2025 and February 2026. The four-market quarter measured here, €499m and 69.9% affiliate, is the last clean picture of TikTok Shop Europe before per-country registration stops being the shape of the problem.
*Method
Category data: Kalodata exports for France, Germany, Spain and Italy, filtered to level-one categories, covering 11 April to 9 July 2026. That is 81 of Q2's 91 days plus the first nine days of Q3. 29 categories per market. Affiliate + self-operated + Shopping Mall reconciles to total revenue on every row, as does live + video + product card. Category growth rates are Kalodata's own, taken from the export.
Category data: Kalodata exports for France, Germany, Spain and Italy, filtered to level-one categories, covering 11 April to 9 July 2026. That is 81 of Q2's 91 days plus the first nine days of Q3. 29 categories per market. Affiliate + self-operated + Shopping Mall reconciles to total revenue on every row, as does live + video + product card. Category growth rates are Kalodata's own, taken from the export.
Shop data: Kalodata top-ten shop exports per market, 10 June to 9 July 2026: thirty days, not ninety. Top-ten market shares are computed against the 90-day category GMV divided by three, which assumes a flat daily run rate. GMV is rising, so the June-July month was larger than a third of the window, the real denominator is bigger, and the real shares are lower than the figures quoted. Shop revenue is attributed to the market where the sale occurred, so a storefront selling in three countries appears three times.
On the source: Kalodata estimates GMV from publicly available TikTok data using AI models. It is not TikTok reported revenue, and Kalodata is not a TikTok Shop partner with API access. Kalodata's own FAQ warns that transaction amounts may vary from real-world numbers and advises against using the data where high precision is required. Independent reviews reach the same conclusion: strong for direction and comparison, unreliable for exact figures. Every conclusion drawn here rests on ratios rather than levels, for that reason.
.png?width=64&height=64&name=Adrian%20(1).png)
Adrian Gmelch
Adrian Gmelch is Director of Content at Lengow, where he leads content strategy while staying firmly hands-on: reading the research, and tracking the trends that matter before they go mainstream.